convolinear
A published Python DSP library - load, filter, transform and plot a signal in one line.
Routine signal processing in NumPy and SciPy is ten lines of boilerplate before anything interesting happens, and the intent disappears into the plumbing.
A fluent, immutable Signal type wrapping NumPy and SciPy. Every transformation returns a new Signal, so chains are safe to branch from and read top-to-bottom as the operation they describe.
Published to PyPI and conda. Loading a WAV, bandpassing it, normalising, taking the FFT and plotting it is a single line of Python.
convolinear wraps the power of NumPy and SciPy in a fluent, readable API. Common DSP tasks -
loading audio, filtering, mixing, and spectral analysis - become short, expressive one-liners
instead of 10+ lines of boilerplate.
Extract data from a .wav file, bandpass it, normalise it, take the Fourier transform, and plot it.
All in a single line of code:
Quickstart
Clean up a noisy tone, then find out what is in it:
from convolinear import Signal

tone = Signal.sine(440, duration=1.0, sample_rate=8000)
noise = Signal.noise(duration=1.0, sample_rate=8000, amplitude=0.5, seed=42)

cleaned = (tone + noise).bandpass(300, 600).normalize()

spectrum = cleaned.fft()
print(f"Dominant frequency: {spectrum.peak_frequency:.1f} Hz")  # ~440.0 Hz

for freq, magnitude in spectrum.top_n(3):
    print(f"{freq:7.1f} Hz   magnitude {magnitude:.4f}")
Every transformation returns a new object - the original is never modified, and a Signal's
sample array is genuinely read-only - so branching from one source is always safe.
Not just audio
Sample rates are floats, and rates below 1 Hz work exactly like any other. Three years of daily temperatures, one sample per day:
sig = Signal(temps, sample_rate=1 / 86400)
cycle_hz = sig.remove_dc().fft(window="hann").peak_frequency
print(f"Dominant period: {1 / cycle_hz / 86400:.0f} days")  # Dominant period: 365 days
The full walkthrough, including how temps is generated, is in
Daily data: finding slow cycles.
Capabilities
- Load from anywhere - WAV, FLAC/OGG/MP3 (via soundfile), CSV, Parquet, NumPy, pandas, MATLAB, or generated tones, noise and arbitrary functions. Sample rates are inferred from dated data.
- Transform - normalize, trim, gain, concat, resample, window, remove DC, reverse, clip, fade.
- Filter - Butterworth lowpass, highpass, bandpass and bandstop.
- Analyse - convolution and correlation, time-delay estimation, peak detection.
- Frequency domain -
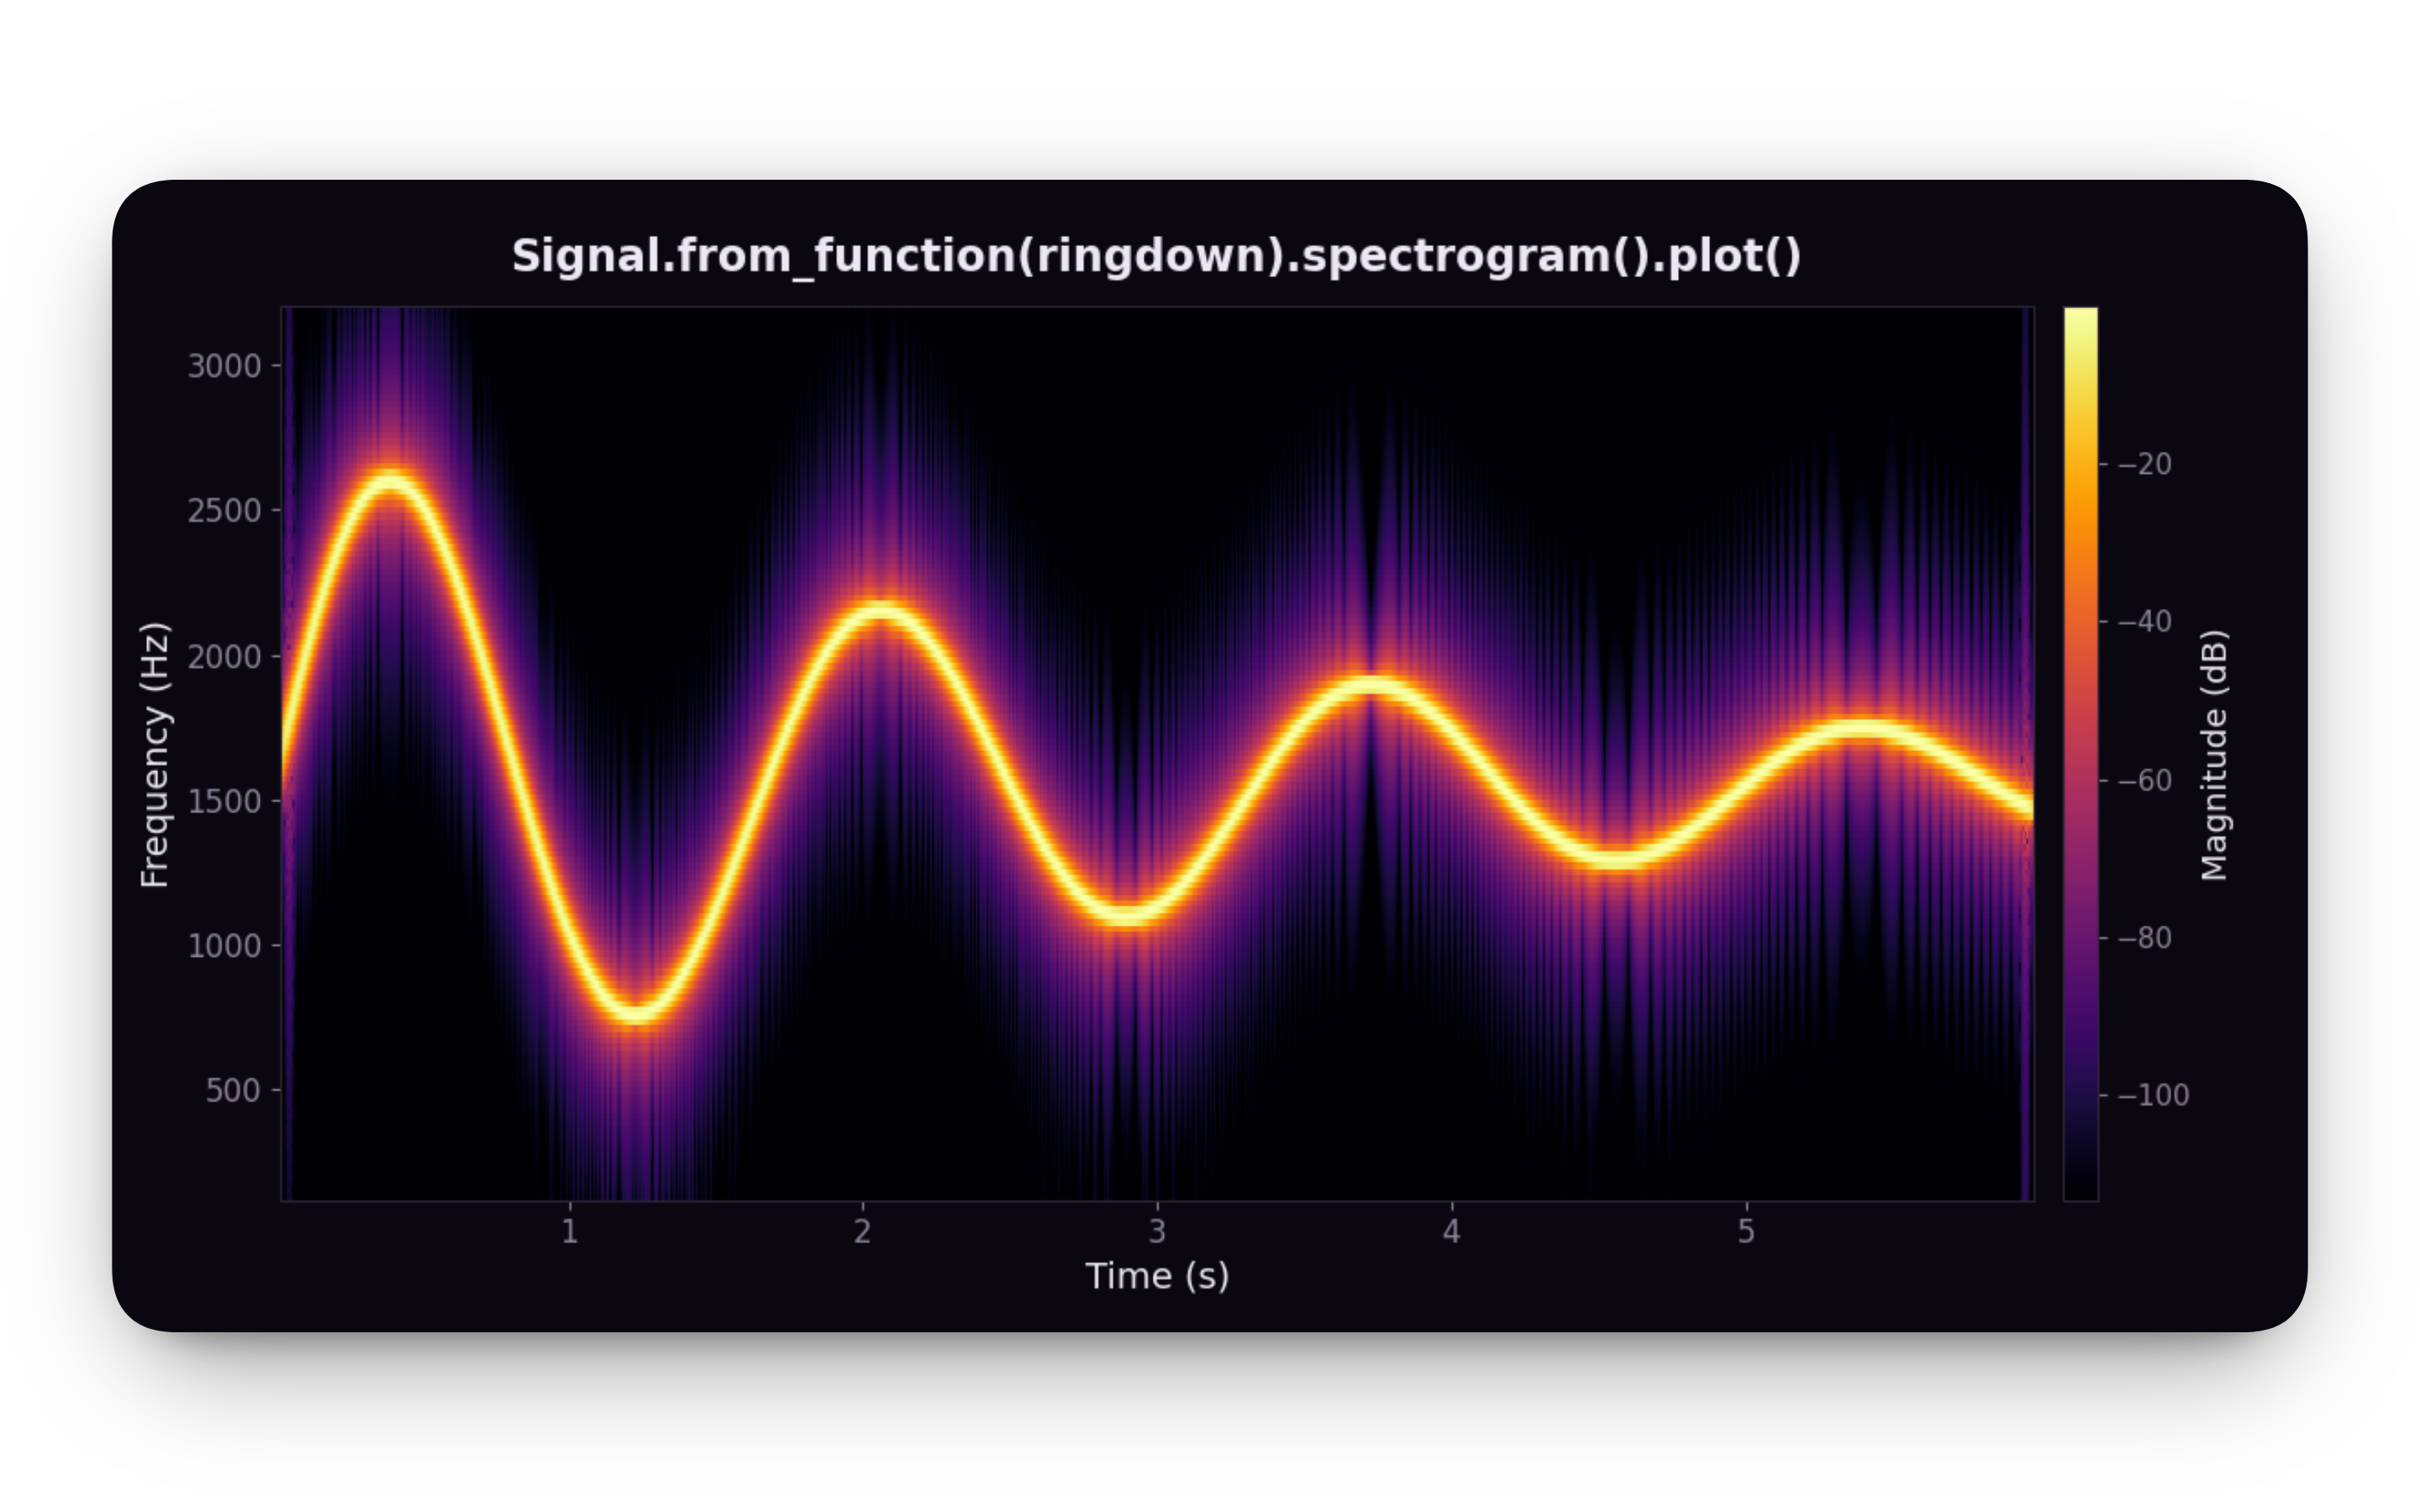
fft()returns aSpectrumof raw complex coefficients that inverts losslessly;psd()gives a Welch power spectral density;spectrogram()shows how content evolves over time. - Plot - one-call matplotlib views of any signal, spectrum, PSD or spectrogram.