Trading Strategy Backtest
An event-driven backtesting engine running entirely in the browser - no backend at all.
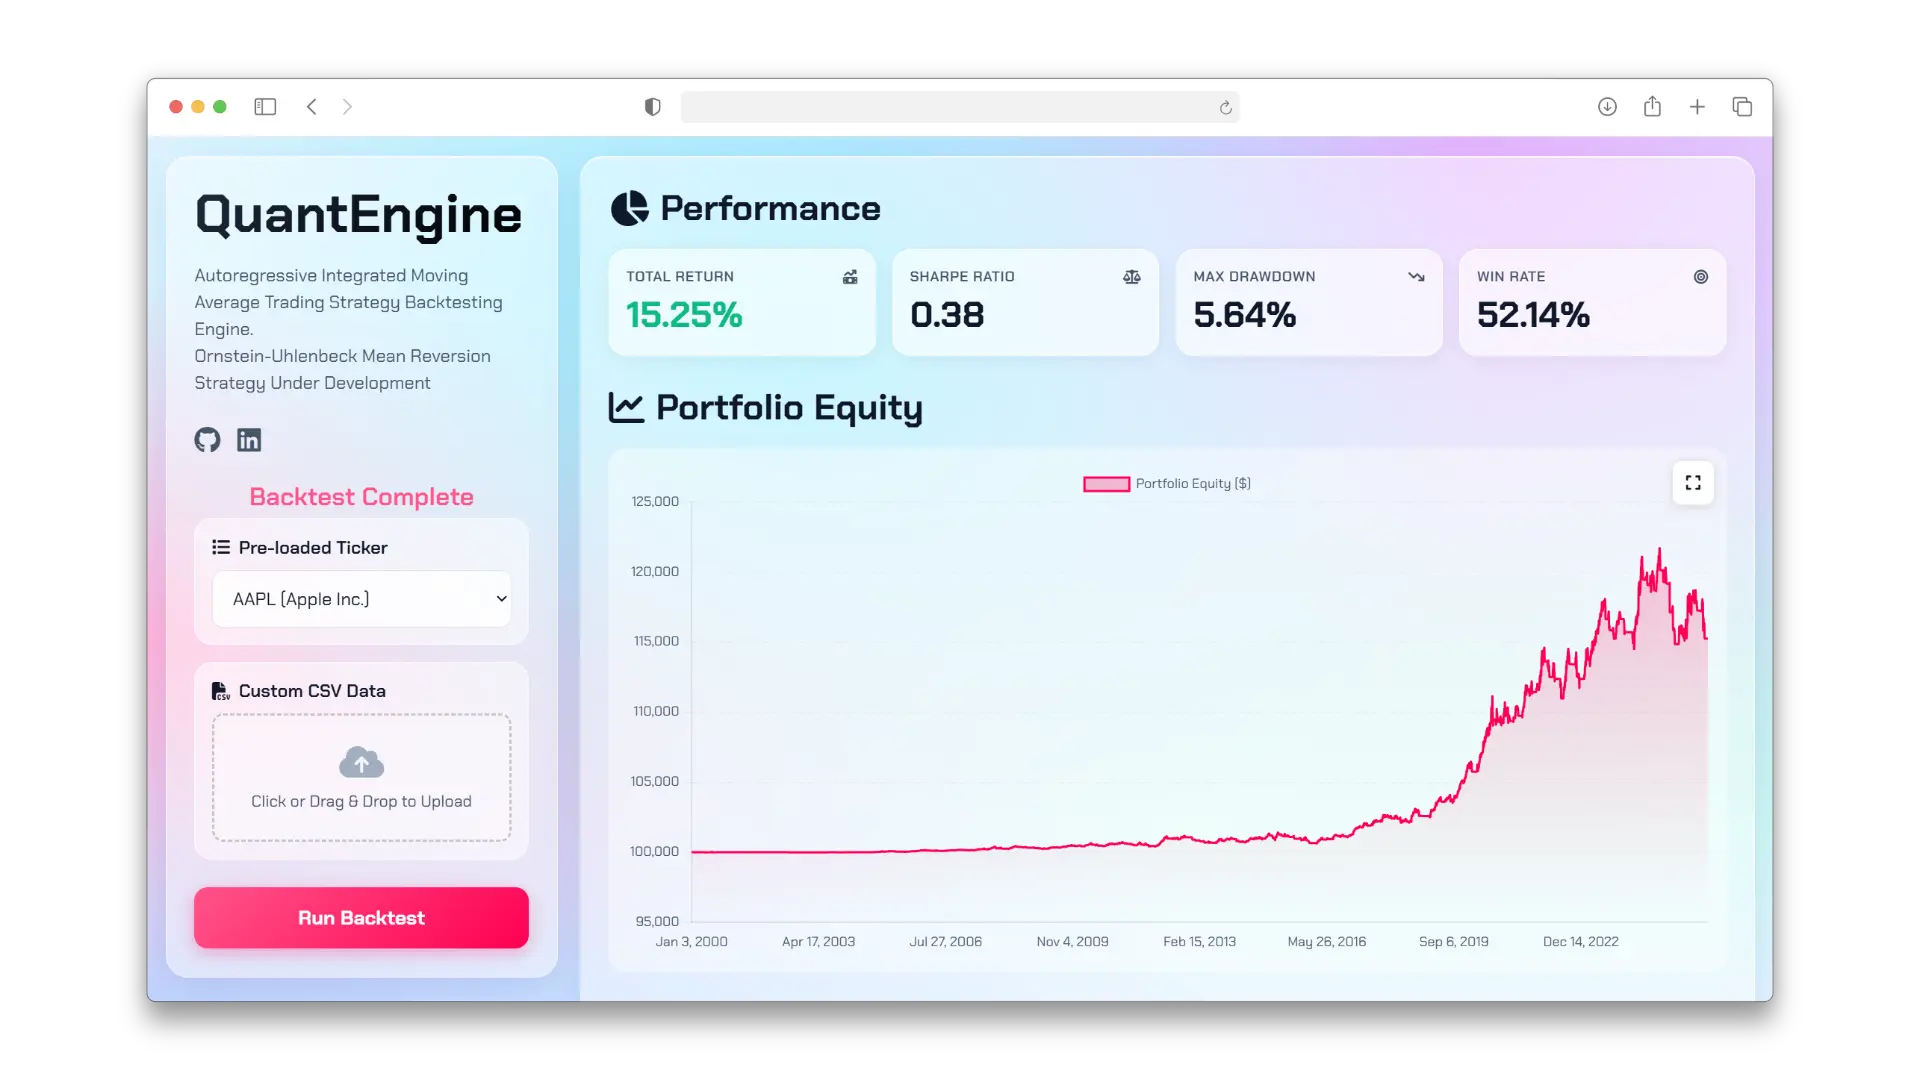
Backtesting engines usually need a server and a local Python environment, and the naive ones quietly leak future data into past decisions.
An event-driven core - Market, Signal, Order, Fill - runs on PyScript and Pyodide, so the original Python executes as WebAssembly in the browser. The CSV handler streams row by row, which both bounds memory and structurally prevents lookahead bias.
Full backtests with Sharpe ratio, max drawdown, win rate and a live equity curve, computed locally with no data leaving the machine.
A trading-strategy simulator that also measures how much of a strategy's success is real and how much is luck.
What it is
A backtest replays historical prices and asks: "if I had followed this trading strategy, what would have happened?" This project is a backtesting engine written in Python that runs entirely in a web browser. Open the link, pick a stock and a strategy, and it simulates every trade over 26 years of daily prices in under a second. The same engine also runs from the command line, with scripts that reproduce all of the research below.
The problem
Backtests have a reputation for flattering the strategies they test. Three mistakes do most of the damage:
- Using information from the future. If the simulator lets a strategy trade at a price from before its decision could really have been made, it gets an advantage that does not exist in real trading.
- Trying many versions and keeping the best one. Test enough settings and one of them will look good by luck alone.
- Mistaking noise for a pattern. Prices move randomly much of the time, and a short stretch of random movement can look like a pattern.
What this project does about it
- An honest simulator. A strategy can only trade at prices that would really have been available: it decides at one day's closing price and trades at the next day's opening price. Trading costs are included.
- Tools that measure luck. It re-tests strategies on years they were not tuned on, applies a statistical correction for having tried many settings, and checks whether a price pattern can be told apart from random movement.
- Checked against known answers. 162 automated tests, including one checked by hand down to the cent, and a trade-by-trade comparison with backtrader, an established open-source backtesting library. The checks run on every code change, and the live site updates only if all of them pass.
What it found (Apple stock, 2000 to 2026)
- Re-tuning a strategy every year did no better than simply buying and holding Apple, once risk is taken into account. On the Sharpe ratio, a standard measure of return per unit of risk, the re-tuned strategy scored 0.97 at best and buy-and-hold scored 1.06. The winning settings also kept changing: 10 different ones in 22 years.
- A small timing mistake makes a strategy look far better than it is. Letting the simulator trade at the start of the same day the decision was made, hours before the information existed, more than doubled the return and raised the Sharpe ratio from 0.57 to 0.99. The engine is built so this cannot happen.
- Apple's price showed no reliable short-term "bounce-back" pattern. A statistical test for a pattern passed on 4.4% of 60-day periods, about as often as it passes on prices generated at random (5.2%).
Built with: Python (NumPy, pandas), PyScript and Pyodide (Python in the browser), JavaScript and Chart.js, pytest, GitHub Actions and Vercel. Areas covered: event-driven system design, statistics for finance, testing and verification, CI/CD and front-end development.
2.7 Limitations
- One instrument per run. There are no multi-asset portfolios.
- Market orders at the open only. There are no limit orders, intraday fills or partial fills. Trading volume is ignored, so a large order costs the same fixed slippage as a small one.
- Simplified short selling. There are no margin calls, maintenance margin or borrowing fees.
- No risk-free rate in the Sharpe ratio. Returns are compared with zero.
- One stock, chosen with hindsight. Apple is one of the most successful stocks of the period, so results on it are not typical of stocks in general.
- Walk-forward simplifications. Positions are not carried across test-year boundaries, and the results depend on where the boundaries fall (0.72 to 0.97).
- Confidence intervals. The bootstrap's average block length is a rule of thumb, n^(1/3), not an optimised choice. The intervals do not account for the selection of settings or for parameter changes at year boundaries.
- Deflated Sharpe Ratio. The effective number of tries uses Nyholt's eigenvalue method, a simple stand-in for the clustering approach of López de Prado & Lewis (2019). Below two effective tries no deflation is applied. It counts only the 16 settings in the grid, not earlier choices such as picking this strategy family or this grid.
- Mean-reversion test power. A 60-bar Dickey-Fuller test has little power, and entries ignore trading costs when deciding whether a move is large enough.
2.8 Challenges and lessons learned
The project went through several rounds of development, review and correction. These are the problems that taught the most.
Problems solved
- The first version filled orders at the closing price that produced the signal, a look-ahead. Orders now fill at the next bar's open (see Fill timing). Lesson: the fill-timing rule is the most important line in a backtester, and it needs a test that pins it down.
- Slippage was counted twice. It was built into the fill price and then subtracted from cash again, as a per-share amount treated as a dollar total. Exits had no slippage at all. Now slippage lives only in the fill price, and the unit of every cost field is written into the event definition. Lesson: when a number passes between components, write its unit down and check it against a hand calculation.
- The strategy assumed every order filled. If an order was rejected, it believed it held a position it did not have and ignored later signals. Orders now report failures back, and the strategy tracks intent and position separately. Lesson: test the unhappy paths of a state machine, not just the normal flow.
- Walk-forward test years started "cold". Each test year began with empty moving averages, so the strategy could not trade until its long average had filled: 24 days with a 25-day average, and 199 of the year's 250 days with a 200-day one. Across the 22 test years of that version, 1,928 of 5,500 test days (35%) were lost this way. Runs are now warmed up with the bars before their start. Lesson: check how many bars a strategy could actually trade before trusting its results.
- The first mean-reversion check passed 95% of random walks. The check is now a Dickey-Fuller test, and a script measures every check's pass rate on random walks. Lesson: test detectors on data where the right answer is known.
- Some tests could never fail. One only checked that a constructor stored its arguments. Another compared two return series that were identical by construction, so it could never catch an error in the benchmark-relative metrics. Both were removed or rewritten. Lesson: a test is only useful if it fails when the code is wrong. Break the code on purpose to check, and test what the code does, not how it does it.